What the NAR data actually says.
The National Association of REALTORS® publishes the Profile of Home Staging every two years. The most recent edition, released in 2025, surveyed 1,266 real estate professionals. The three numbers that matter for an ROI conversation:
of buyers’ agents said staging made it easier for the buyer to visualize the property as a future home.
of sellers’ agents reported that staging reduced a home’s time on market.
of agents reported staging produced a 1–10% increase in offer price vs comparable unstaged listings.
Source: NAR 2025 Profile of Home Staging, published May 2025. Survey methodology: 1,266 usable responses from a random sample of active REALTORS®.
NAR’s survey doesn’t distinguish between physical and virtual staging in the headline numbers — agents report the outcome from the staging method they used, which is increasingly virtual for vacant and tenant-occupied listings. A handful of vendor-published A/B tests (Stuccco, Styldod, BoxBrownie) suggest the lift from virtualstaging is comparable to physical on the engagement metrics (clicks, time on listing page, saved listings) but we treat those as vendor-interested data and don’t anchor on them.
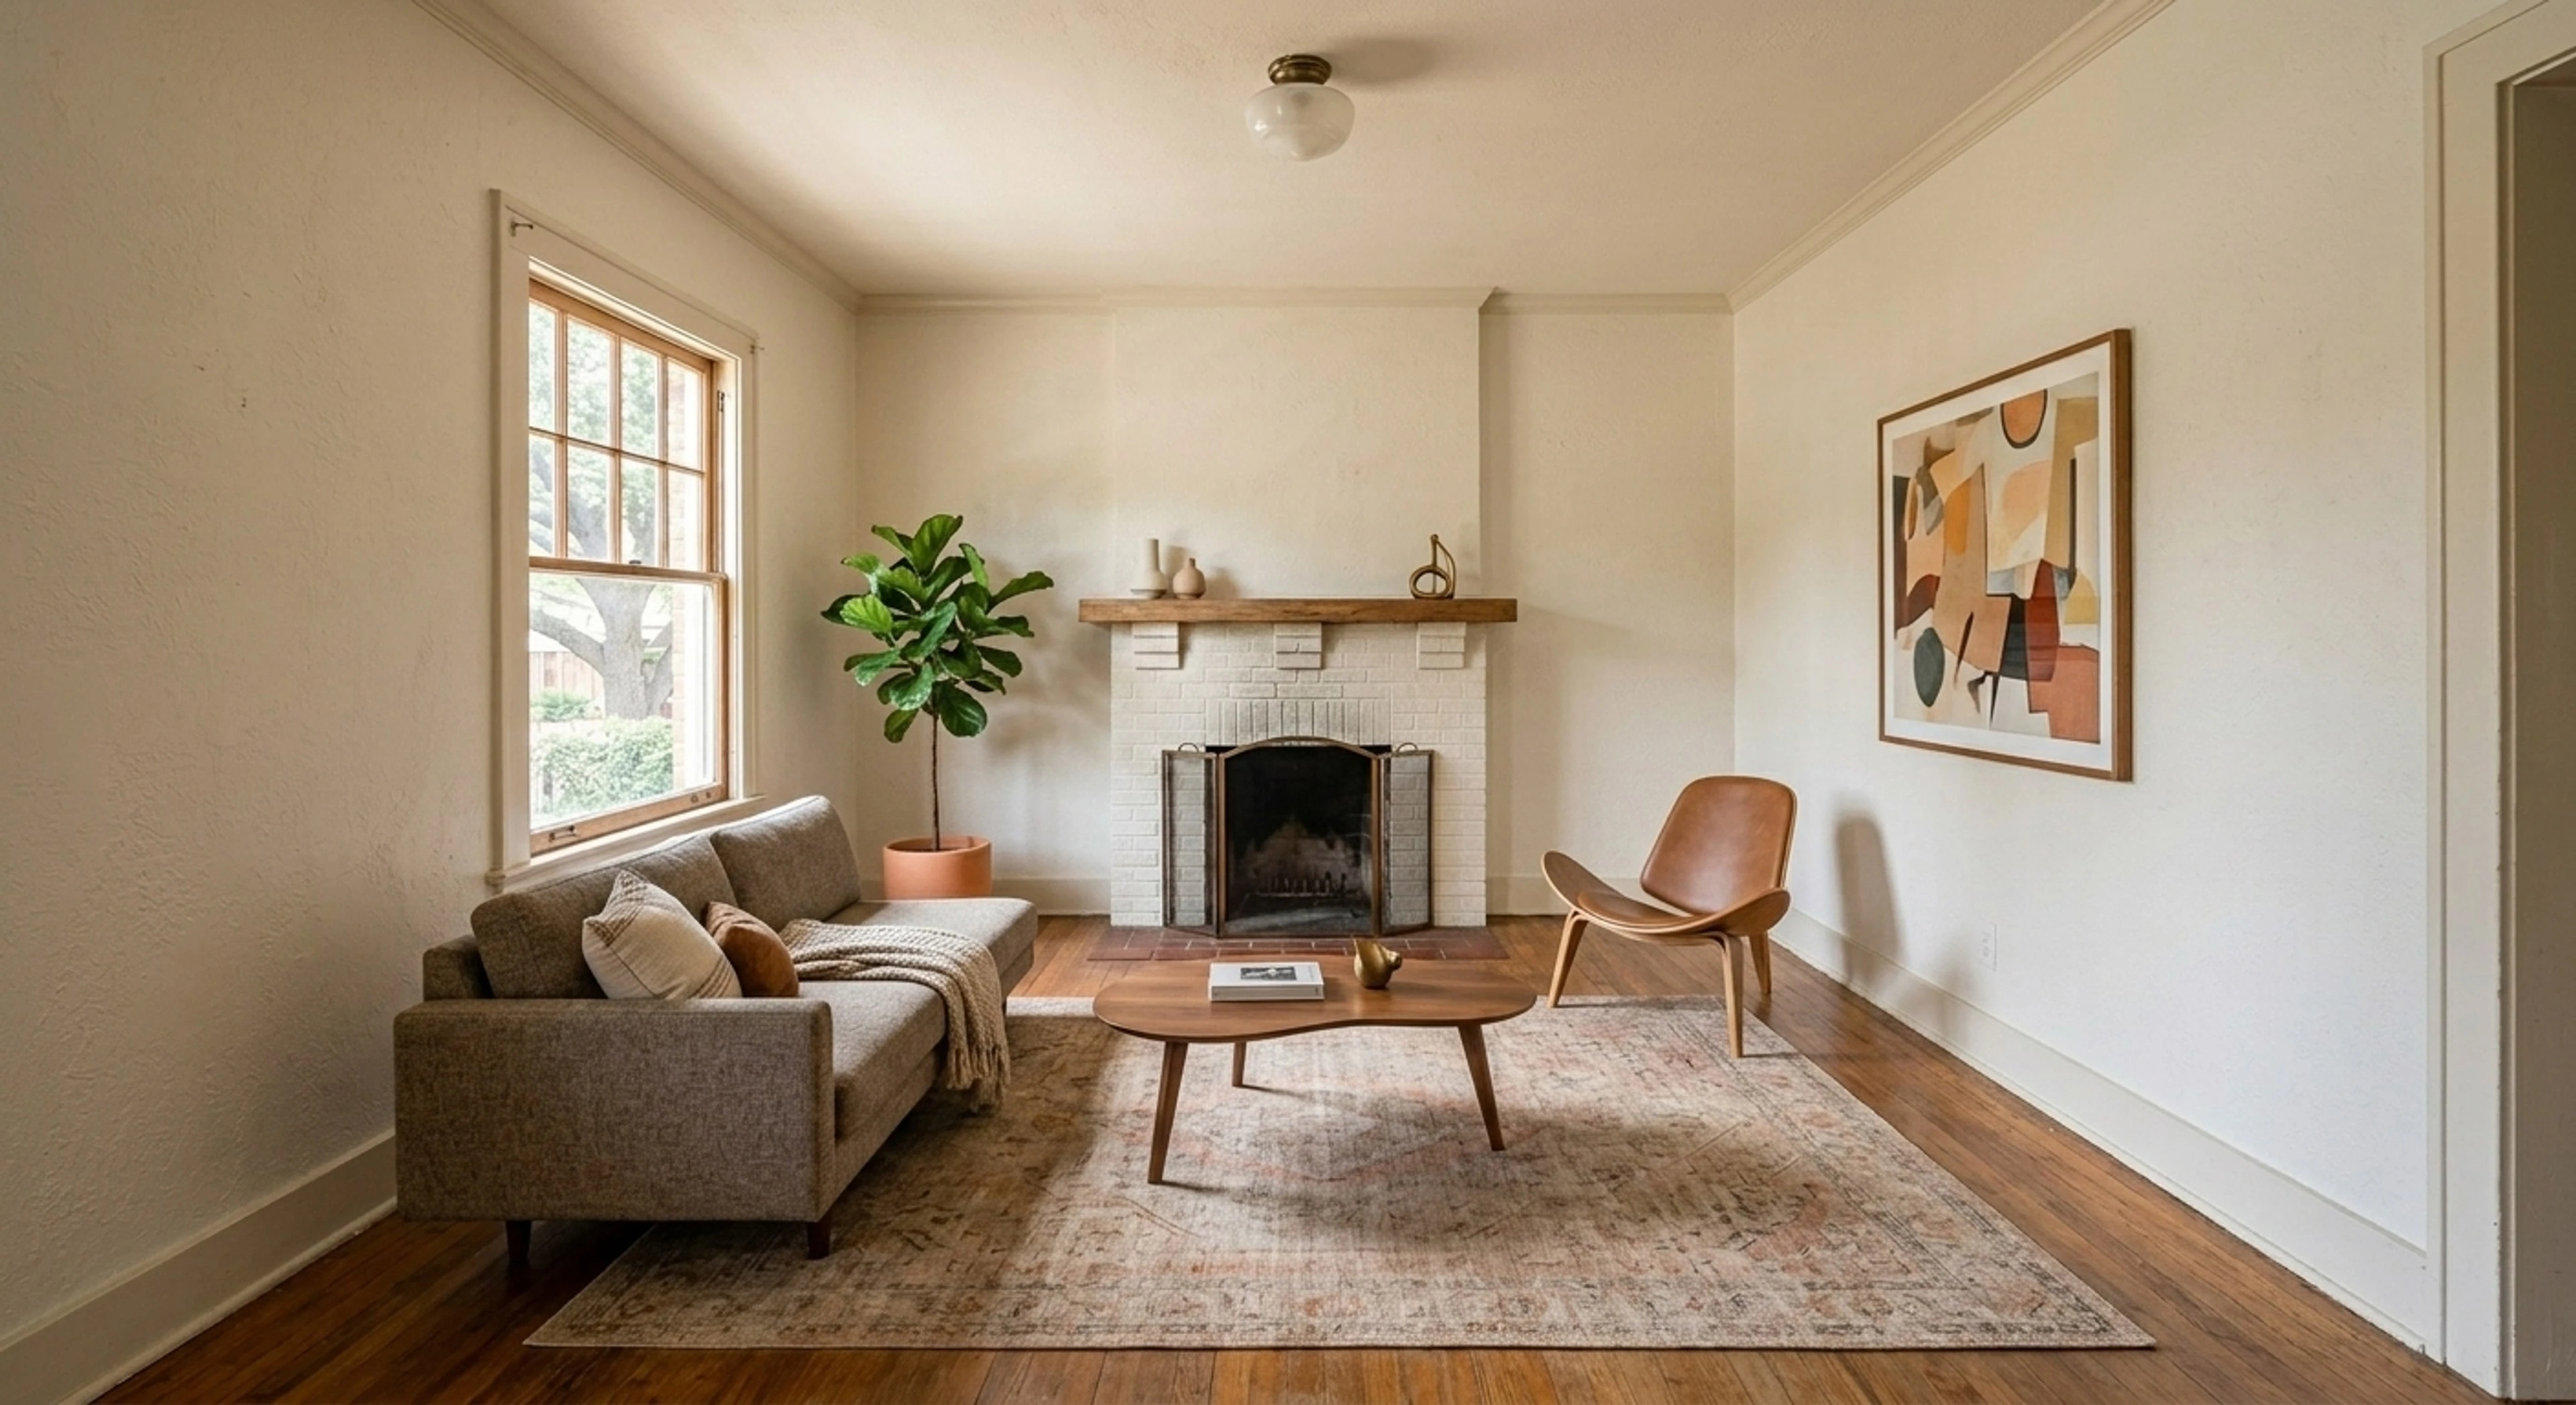
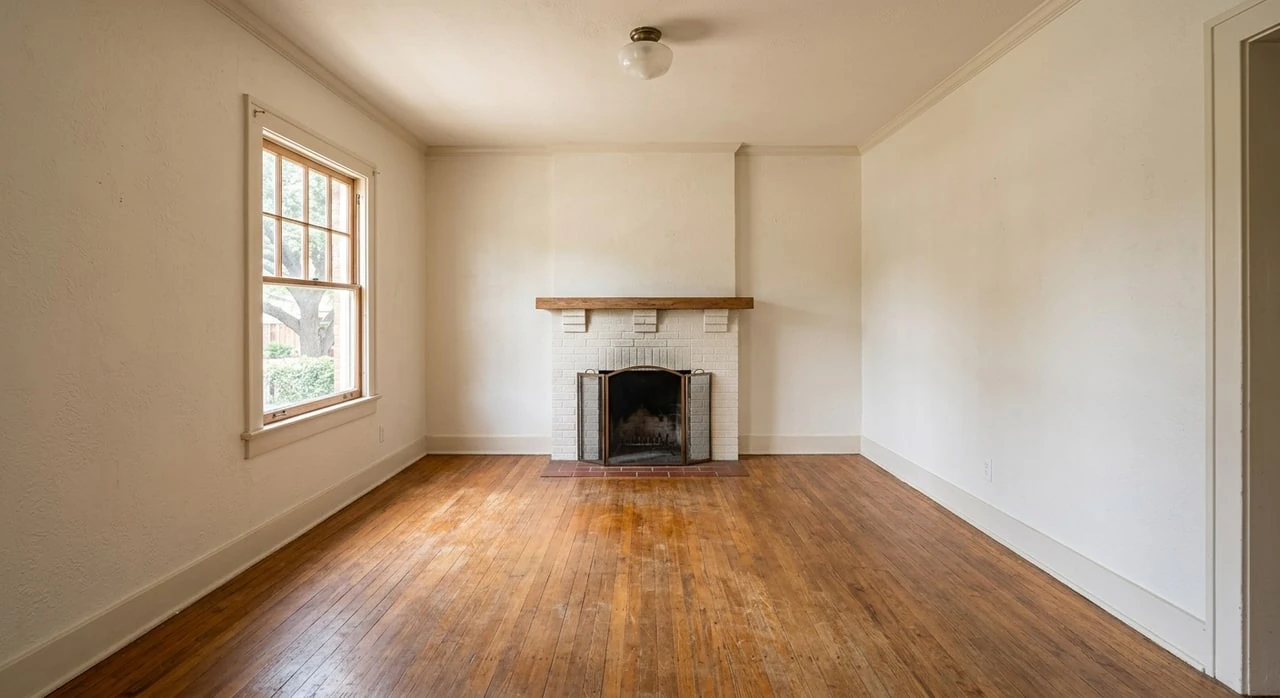
See the intervention.
The 83% visualization number makes sense the moment you compare a vacant room photo to a staged one. An empty room looks smaller, reads as architecturally uninteresting, and forces the buyer to do spatial math.
Physical staging costs — the 2025 baseline.
Physical staging is expensive, even before you account for storage, moving, and wear. 2025 cost data from HomeAdvisor and Thumbtack:
- Median first-month staging cost for a vacant single-family home: $1,844.
- Monthly rental cost to keep staged furniture in place: $500–$1,200 per month after month one.
- Vacant-home full staging budget (multi-month listing period): ~$4,500.
- Per-room rental (for partial staging): $300–$700 per month.
Call this $2,000–$5,000 total for a typical 30–60 day listing, tilted toward the high end in markets where inventory moves slowly. Every extra month the listing sits, the cost compounds.
Virtual staging costs — the three cost curves.
Virtual staging cost depends heavily on which tool you use. There are three distinct cost curves.
| Tool | Per room | 6-room listing | Turnaround |
|---|---|---|---|
| BoxBrownie (human) | $24–$176 | $144–$1,056 | 24–48 hours |
| Styldod (human) | $16–$32 | $96–$192 | 12–24 hours |
| Plotpane Pro (SaaS, unlimited) | ~$2 marginal | $12 marginal | ~90 seconds |
Per-room cost for Plotpane is $79/mo ÷ 40 rooms per Pro allowance; the “6-room listing” figure is the incremental credit draw against the monthly subscription, not a per-listing invoice.
The $750K worked example.
Consider a $750,000 single-family listing, vacant, in a market where the median days-on-market is 35. The seller is paying roughly $3,200 a month in carrying cost (mortgage interest, tax, utilities, HOA), or about $107 a day. The agent’s commission on a sold listing at 2.5% is $18,750. Here is the decision matrix.
| Scenario | Staging cost | Est. DOM | Carrying cost | Total |
|---|---|---|---|---|
| Unstaged | $0 | 45 days | $4,815 | $4,815 |
| Physical staging | $3,500 | 30 days | $3,210 | $6,710 |
| BoxBrownie (6 rooms, human edits) | $264 | 32 days | $3,424 | $3,688 |
| Plotpane Pro (6 rooms, part of $79/mo) | $12 marginal | 32 days | $3,424 | $3,436 |
A few caveats: we are assuming the NAR directional finding (staging reduces DOM) rather than quantifying the exact delta (which the NAR survey doesn’t publish in days). We are not crediting the 1–10% price bump the NAR report also documents — if you credit even 1% on a $750K sale, that’s another $7,500 in the staged column.
Even under the stingiest reading, virtual staging dominates. The open question is whether you pay per image or pay a flat subscription.
Break-even: four listings a month.
Here’s the break-even calculation for Plotpane Pro at $79/mo vs BoxBrownie at $44/room (their mid-tier, realistic typical rate).
$79 Plotpane Pro ÷ $44 BoxBrownie per room = 1.8 rooms
You break even on your second staged room of the month. Four listings with a couple of staged rooms each puts you well past break-even before the second week.
What virtual staging does not fix.
Virtual staging sells the layout. It does not sell the neighborhood, the school district, the commute, or the flooring the buyer will step on during the walkthrough. If a room has dated finishes the seller won’t update, you can virtually renovate it — but then the in-person walkthrough becomes the disappointment moment. Use virtual staging on the presentation of empty rooms. Use virtual renovation sparingly, and always disclose it.
For the full MLS disclosure playbook, see our virtual staging disclosure guide.
Related reading.
Plotpane Pro covers its own cost on your second staged room. Everything after that is margin.